Matplotlib figure
Python code:
import matplotlib.pyplot as plt
import numpy as np
t1 = -1.0 #! - start argument value for figures plots
t2 = 2.0 #! - end argument value for figures plots
t = np.arange(t1, t2, 0.01)
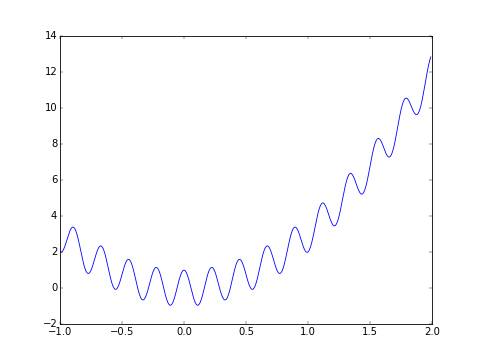
#! Figure 1
s1 = np.cos(9*np.pi*t) + 3 * t ** 2 #%equ
plt.figure(1)
plt.plot(t, s1) #%plt
plt.clf()
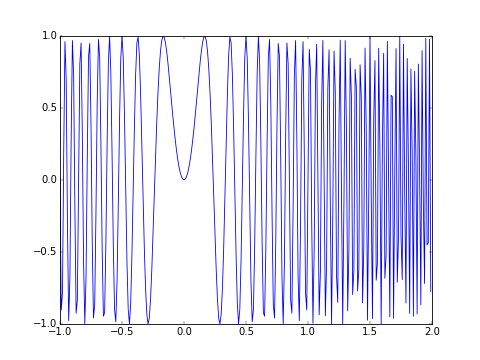
#! Figure 2
s2 = np.sin(18*np.pi*t**2)
plt.figure(2)
plt.plot(t, s2)
plt #%plt
plt.clf()
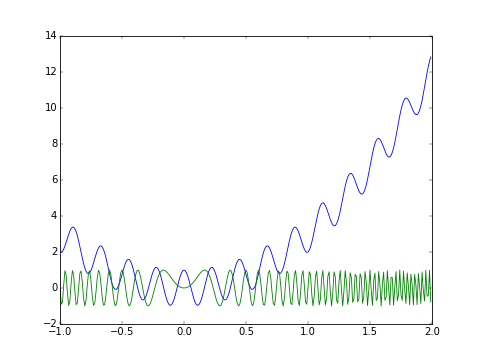
#! All figures in one
plt.figure(4)
plt.plot(t, s1)
plt.plot(t, s2)
plt #%plt
plt.clf()
Loge output report:
t1 = -1.0 - start argument value for figures plots
t2 = 2.0 - end argument value for figures plots
Figure 1
s1 = np.cos(9*np.pi*t) + 3 * t ^ 2 - figure formula
 Alt text
Figure 2
s2 = np.sin(18*np.pi*t^2) - figure formula
 Alt text
All figures in one
 Alt text